Dashboard
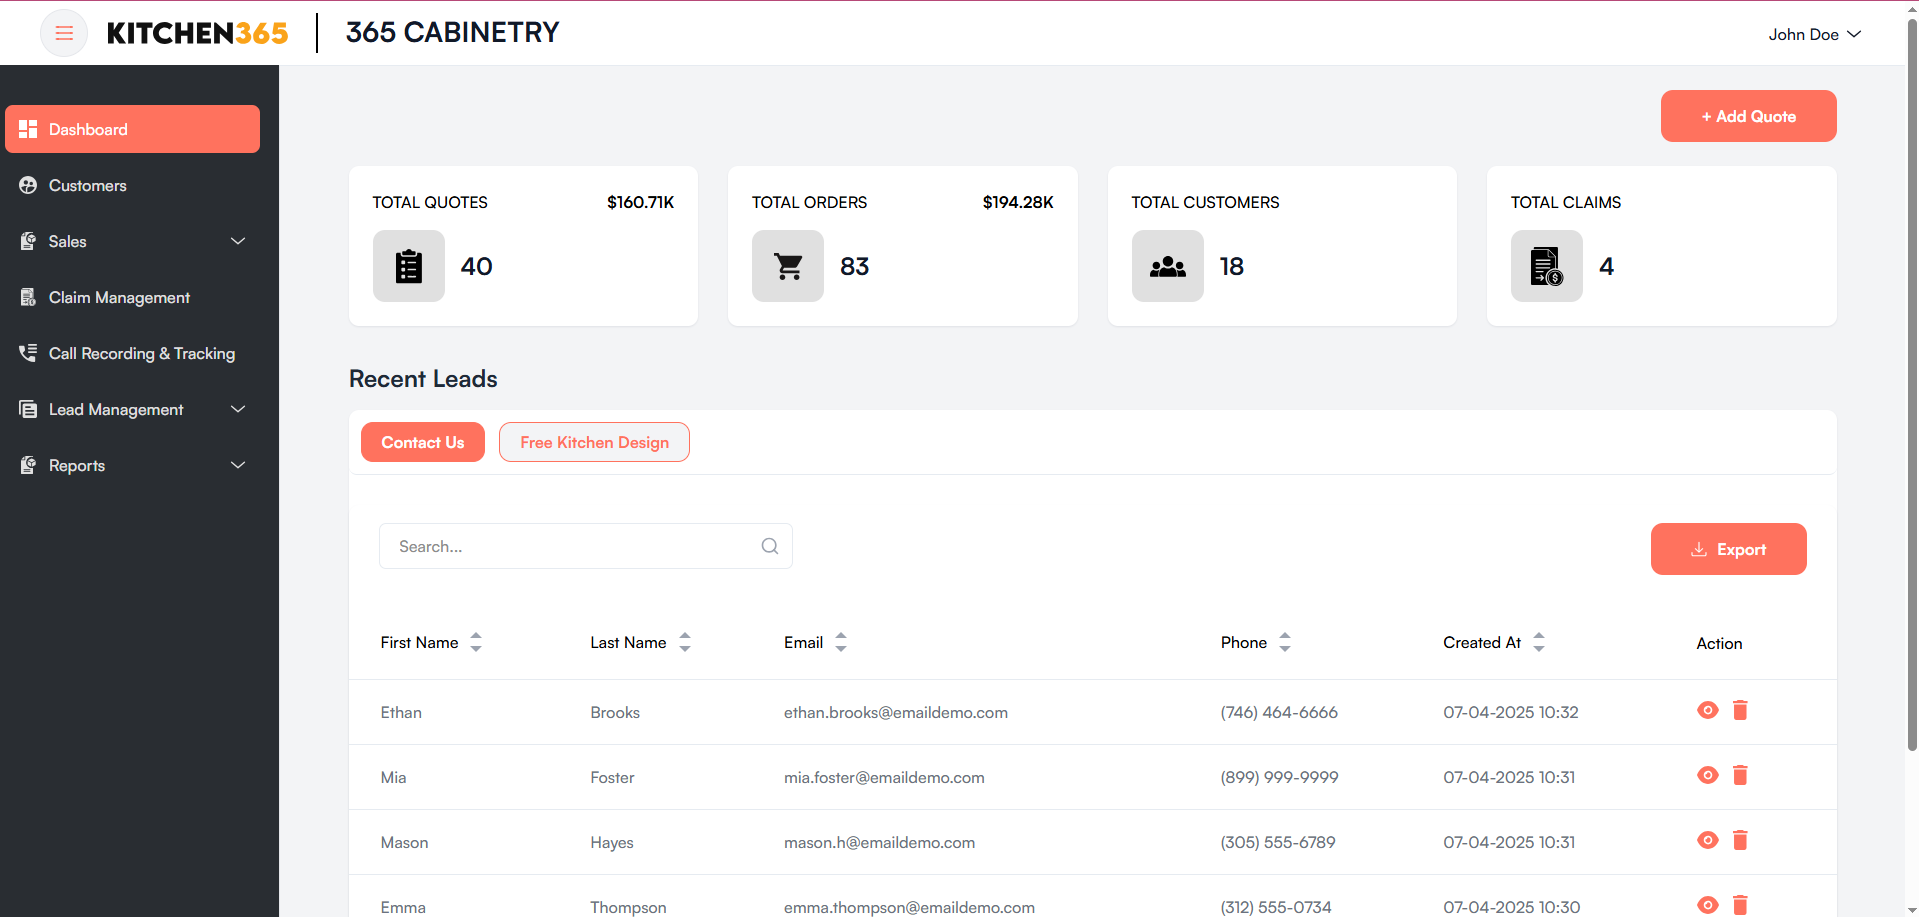
The Dashboard is the landing page of the Admin Console. It provides users with a quick summary of quotes, orders, customers, and claims, along with a table of the most recent leads. This screen is essential for monitoring sales activity and managing leads efficiently.
a. Dashboard Metrics Cards
At the top of the dashboard, four cards summarize the key stats:
-
Total Quotes
- Displays the number of quotes created and their total estimated value.
- Example: 22 quotes totaling $84K
-
Total Orders
- Shows the number of completed orders and the total order value.
- Example: 41 orders worth $99.8K
-
Total Customers
- Indicates the number of unique customers in the system.
- Example: 16 customers
-
Total Claims
- Displays the number of submitted customer claims.
- Example: 3 claims
b. Add Quote Button
Located in the top right corner, this red "+ Add Quote" button allows users to create a new quote quickly. (More info on Quote creation in the Quote Management section.)
c. Recent Leads
This section displays a table of leads who have interacted with your frontend site via forms like Free Kitchen Design or Contact Us.
| Column | Description |
|---|---|
| Email address submitted by the lead. | |
| First Name | First name of the lead. |
| Last Name | Last name of the lead. |
| Phone No. | Contact number provided by the lead. |
| Type | Indicates how the lead interacted (e.g., “Free Kitchen Design” or “Contact Us”). |
| Created At | Date and time the lead was created or submitted. |
| Action | Eye icon 👁️ allows the user to view full details of the lead. |
- You can sort the data by clicking on the arrows next to column headers.
- Pagination control is available at the bottom right for browsing through multiple lead entries.
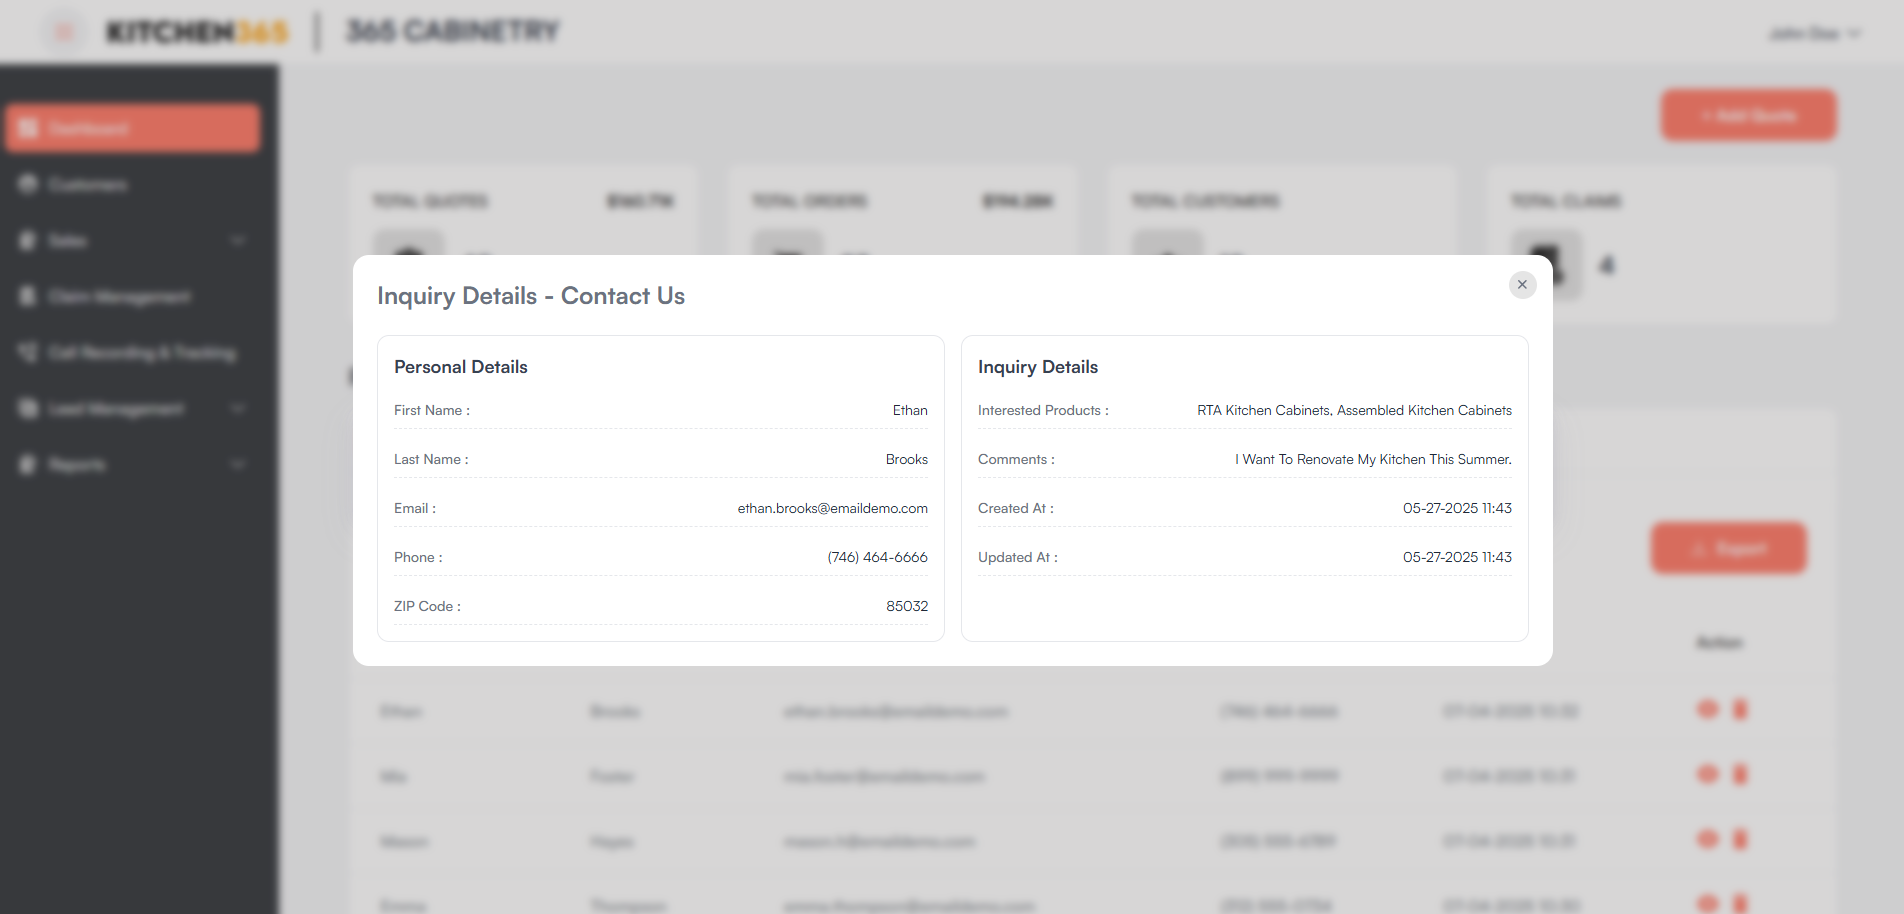
To view the full details of a lead, click on the eye icon in the respective entry. A popup will appear as shown below.