Reports
The Reports module in the Kitchen365 Console v2.0.0 gives you visual analytics for your website traffic and lead generation. It is split into two pages:
| Page | Console Label | What It Shows |
|---|---|---|
| Website | Web Analytics | Google Analytics data — sessions, page views, users, top pages, and traffic channels |
| Leads | Lead Reports | Form submission trends — leads over time, totals by form type, and lead sources |
Use Website reports to understand how visitors use your site. Use Leads reports to track how many leads each form generates and where those leads come from.
- Individual form submissions are managed in Lead Management.
- Recent leads also appear on the Dashboard.
- Access to each report page is controlled through Staffs Management role permissions.
Access
How to open Reports
- Log in to the Kitchen365 Console.
- In the left sidebar, expand Reports.
- Choose one of the sub-menu items:
| Menu Item | Page Title | URL Path |
|---|---|---|
| Website | Web Analytics | /reports/website-reports |
| Leads | Lead Reports | /reports/lead |
The Reports menu appears only when your account has permission to view at least one report type. Each sub-item also requires its own permission:
| Sub-menu | Permission Required |
|---|---|
| Website | Website Reports |
| Leads | Lead Reports |
If you do not see the menu, contact your tenant administrator to update your role permissions in Staffs Management > Manage Roles.
Common Controls
Both report pages share the same time range filter in the top-right corner.
Time Range Filter
Select a preset period from the dropdown. All charts and tables on the page (except Overall Monthly Trends on the Website page) refresh for the selected range.
| Option | Description |
|---|---|
| This Week | From the start of the current week through today |
| Last Week | The full previous calendar week |
| Last 7 Days | Rolling 7-day window ending today |
| Last 14 Days | Rolling 14-day window ending today |
| Last 30 Days | Rolling 30-day window ending today |
| This Month | From the 1st of the current month through today |
| Last Month | The full previous calendar month |
| This Quarter | From the start of the current quarter through today |
| Last Quarter | The full previous calendar quarter |
| This Year | From January 1 of the current year through today |
| Last Year | The full previous calendar year |
While data is loading, each widget shows a skeleton placeholder. If no data exists for the selected period, the widget displays No data available.
a. Website Reports (Web Analytics)
Breadcrumb: Dashboard / Web Analytics
Website reports pull data from Google Analytics 4 (GA4) for your tenant's website. The page shows five widgets stacked vertically.
Prerequisites
Website reports require Google Analytics to be configured on your tenant account. Your Kitchen365 administrator must set up the following tenant attributes:
| Setting | Purpose |
|---|---|
| Property ID | Your GA4 property identifier |
| Google Analytics Client Email | Service account email for GA4 API access |
| Google Analytics Private Key | Service account private key |
| Google Analytics Project ID | Google Cloud project ID |
If any of these values are missing, the Website reports page loads but charts remain empty.
Website analytics data is cached for 1 hour per time range. Changing the time range or waiting for the cache to expire fetches fresh data from Google Analytics.
i. How is your website performing?
A bar chart at the top of the page compares Current and Previous period totals side by side.
| Metric | Description |
|---|---|
| Users | Unique active users who visited the site |
| Page Views | Total number of pages viewed |
| Sessions | Total browsing sessions |
The Previous period is automatically calculated based on the selected time range (for example, if you choose This Week, the previous period is last week). Use this chart for a quick snapshot of whether traffic is up or down.
ii. Sessions / Page Views / Users
A line chart showing daily trends for the selected time range.
| Series | Description |
|---|---|
| Users | Daily active users |
| Page Views | Daily page view count |
| Sessions | Daily session count |
Hover over data points to see exact values for a given date. The x-axis labels adjust based on the selected time range.
iii. Top Pages
A scrollable table listing the most visited pages on your website.
| Column | Description |
|---|---|
| Page | URL path of the page (for example, /products/cabinets) |
| Page Views | Number of views for that page in the selected period |
A Total row at the bottom shows the combined page views across all listed pages.
iv. Top Channels
A donut chart showing how new users arrived at your site, grouped by GA4 primary channel (for example, Organic Search, Direct, Paid Search, Referral, Social).
Each segment in the legend shows the channel name and its percentage share of new users.
v. Overall Monthly Trends
A table summarizing website activity over the last 6 months. This widget is not affected by the time range dropdown — it always shows a rolling 6-month view.
| Column | Description |
|---|---|
| Month | Calendar month (YYYY-MM format) |
| Sessions | Total sessions in that month |
| Users | Total users in that month |
| Page Views | Total page views in that month |
| Avg. Session Duration | Average time visitors spent per session (HH:MM format) |
| Bounce Rate | Percentage of single-page sessions with no engagement |
A Total row at the bottom sums Sessions, Users, and Page Views across all months. Average Session Duration and Bounce Rate are not totaled.
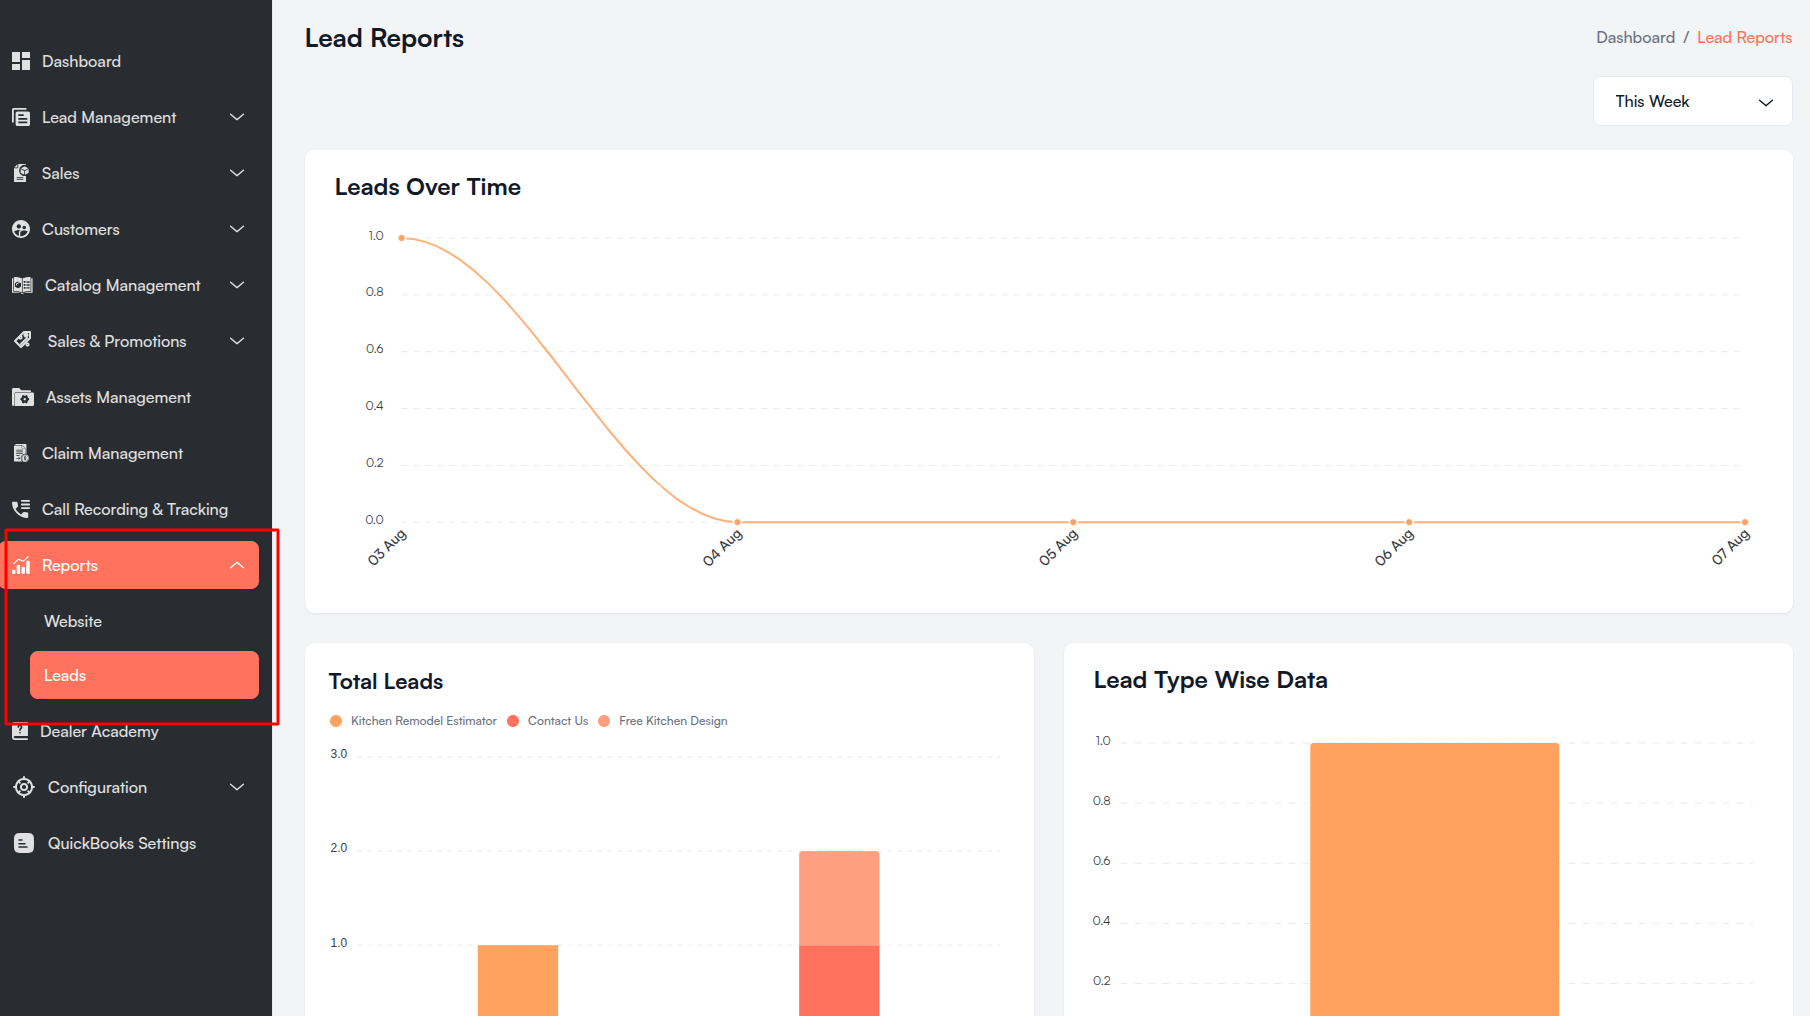
b. Lead Reports
Breadcrumb: Dashboard / Lead Reports
Lead reports analyze form submissions collected from your website. Data comes from the same submissions you manage in Lead Management, including:
- Kitchen Remodel Estimator
- Contact Us
- Free Kitchen Design
- Become a Dealer
- Other CMS forms configured on your site
The page shows four widgets.
i. Leads Over Time
A multi-line chart showing how many leads each form type generated per day during the selected time range.
| Element | Description |
|---|---|
| Lines | One line per form type (labeled by the form's display name) |
| X-axis | Dates within the selected period |
| Y-axis | Number of submissions |
Use this chart to spot spikes, dips, or seasonal patterns in lead volume.
ii. Total Leads
A stacked bar chart comparing lead counts for the Current period against the Previous period, broken down by form type.
| Bar Group | Description |
|---|---|
| Current | Submissions in the selected time range |
| Previous | Submissions in the equivalent prior period |
Each bar segment represents a different form type. Use this to see which forms drive the most leads and whether volume is growing or declining period over period.
iii. Lead Type Wise Data
A bar chart showing the total number of leads per form type for the Current period only.
Each bar represents one form (for example, Contact Us, Free Kitchen Design, Kitchen Remodel Estimator). This gives a simple breakdown of which forms are performing best in the selected window.
iv. Leads by Sources
A donut chart showing where leads heard about your business, based on the "How did you hear about us?" field collected on applicable forms.
| Element | Description |
|---|---|
| Segments | Each answer option submitted by leads (for example, Google, Referral, Social Media) |
| Center label | Total visitor count across all sources |
| Legend | Source name with percentage share |
Only submissions that include a hearAboutUs value are counted. Leads that left this field blank are excluded.
Permissions
Report access is managed through Staffs Management > Manage Roles. When creating or editing a role, assign permissions from the Reports group:
| Permission Group | What Staff Can Do |
|---|---|
| Website Reports | View the Web Analytics page (website performance, sessions, top pages, channels, monthly trends) |
| Lead Reports | View the Lead Reports page (leads over time, totals, type breakdown, sources) |
A staff member needs the matching permission to see each sub-menu item under Reports in the sidebar.
Troubleshooting
Website reports show "No data available"
| Possible Cause | What to Do |
|---|---|
| Google Analytics is not configured | Contact your Kitchen365 administrator to verify GA4 credentials are set on your tenant |
| No traffic in the selected period | Try a wider time range (for example, Last 30 Days) |
| GA4 property has no data yet | Confirm your website tracking code is installed and firing events |
| Cached empty result | Wait up to 1 hour for the cache to expire, then refresh |
Lead reports show "No data available"
| Possible Cause | What to Do |
|---|---|
| No form submissions in the period | Try a wider time range or confirm leads exist in Lead Management |
| Forms are not published on the website | Verify forms are live on the frontend site |
Reports menu is missing from the sidebar
Your role does not include Website Reports or Lead Reports permissions. Ask your tenant administrator to update your role in Staffs Management.
Dates look incorrect
Report timestamps follow your tenant's timezone setting. See Configuration > Timezone Changes if dates appear offset.
Related Guides
- Lead Management — View, export, and manage individual form submissions
- Dashboard — Recent leads summary on the home page
- Staffs Management — Control who can access Website and Lead reports